
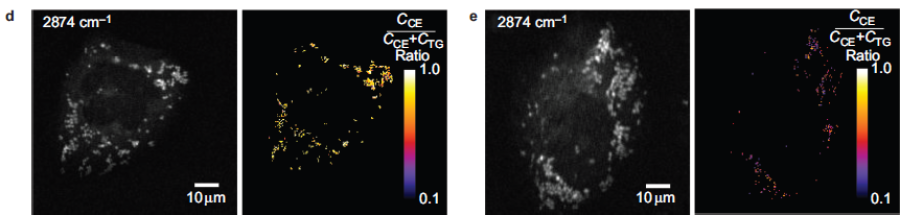
Compositional analysis of lipid droplets in live cancer cells.(d) An SRL image of a single live PC3 cell at 2874 cm21 and the corresponding CE percentage map. To focus on lipid droplet analysis, the background signal was filtered out by a threshold. (e) An SRL image of an avasimibe-treated PC3 cell at 2874 cm21and the corresponding CE percentage map. The pixel dwell time was 32 ms. Scale bar510 mm. CE, cholesteryl ester; SRL, stimulated Raman loss; TG, triglyceride.
Microsecond Scale Vibrational Spectroscopic Imaging by Multiplex Stimulated Raman Scattering Microscopy. Liao CS#, Slipchenko MN#, Wang P#, Hu CR, Li JJ, Oglesbee RA, Cheng JX*. Light: Science & Applications. 2015; 4:e265.
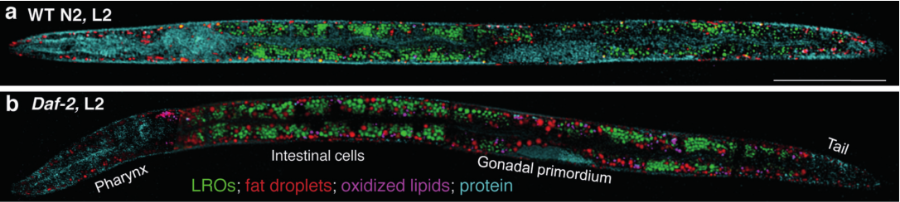
Compositional analysis of intracellular compartments in whole C. elegans worms by hyperspectral SRS imaging, k-means clustering, and MCR analysis. a,b) MCR-retrieved concentration maps of neutral fat droplets, lysosome-related organelles (LROs), oxidized lipids, and protein in the body of whole wild type worms and daf-2 mutants. Scale bar: 50 mm.
Imaging Lipid Metabolism in Live Caenorhabditis elegans Using Fingerprint Vibrations. Wang P, Liu B, Zhang DL, Belew, MY, Tissenbaum HA, Cheng JX*. AngewandteChemieInternational Edition.2014; 53:11787-11792.
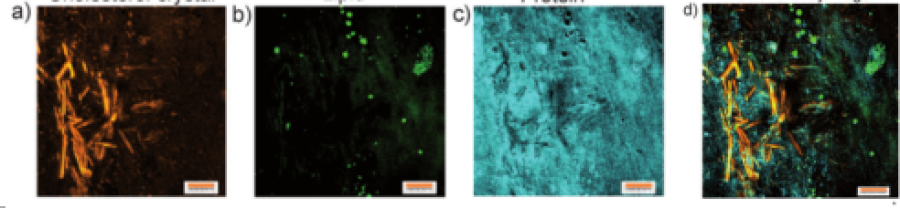
Hyperspectral SRS imaging a–c) Reconstructed concentration images of crystal-lized free cholesterol (yellow), lipid droplets (green), and protein background (cyan). d) Overlay image of (a)–(c)
Label-free quantitative imaging of cholesterol in intact tissues by hyperspectral stimulated Raman scattering microscopy.
Wang P, Li JJ,Wang P, Hu CR, Zhang DL, Sturek, M, Cheng JX*. AngewandteChemieInternational Edition.2013; 52:13042-6.
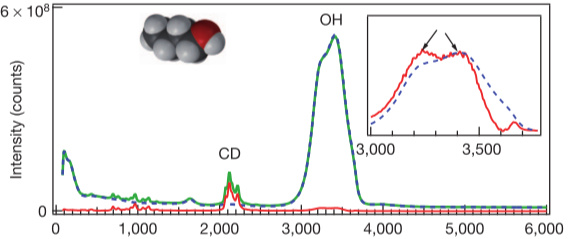
Raman spectra of aqueous n-butanol-d9. Shown are isotopic,polarized and SC Raman spectra at 20 uC that reveal differences between hydrophobic hydration-shell and bulk water structures. Raman spectra of purewater (blue) anda 0.5Maqueous solutionof n-butanol-d9 (green), and the corresponding SC spectrum (red) with features that arise from solute intramolecular vibrations and from hydration-shell water molecules whose vibrational spectrum is perturbed by the solute. The inset shows an expanded view of the SCOHstretch region, and theOHband of pure water scaled to the same maximum intensity. Arrows indicate hydrogen-bonded OH; the small peak on the right is the dangling OH.
Water structural transformation at molecular hydrophobic interfaces. Davis JG, Gierszal KP, Wang P, Ben-Amotz D*. Nature. 2012;491(7425):582-5.